Benchmarking2 min read
Comparable search and TP benchmarking without the Excel archaeology
Screens, FAR scores, Instant PLI, and quartile math in the order OECD actually requires. Prowess, TP Catalyst, and why working backwards from a margin is a liability.

Benchmarking goes wrong in a predictable order. Someone opens a database. Someone ticks 40 companies that "feel similar." Someone computes a range. Someone writes an economic chapter that could be swapped onto any file in the cabinet. OECD comparability analysis is the opposite order: FAR, screens, set, reject with reasons, PLI, range, narrative.
Benchmarking and TP advisory in TP DOC GEN AI is built to enforce that order. This article is the practitioner version.
Design screens you can re-run
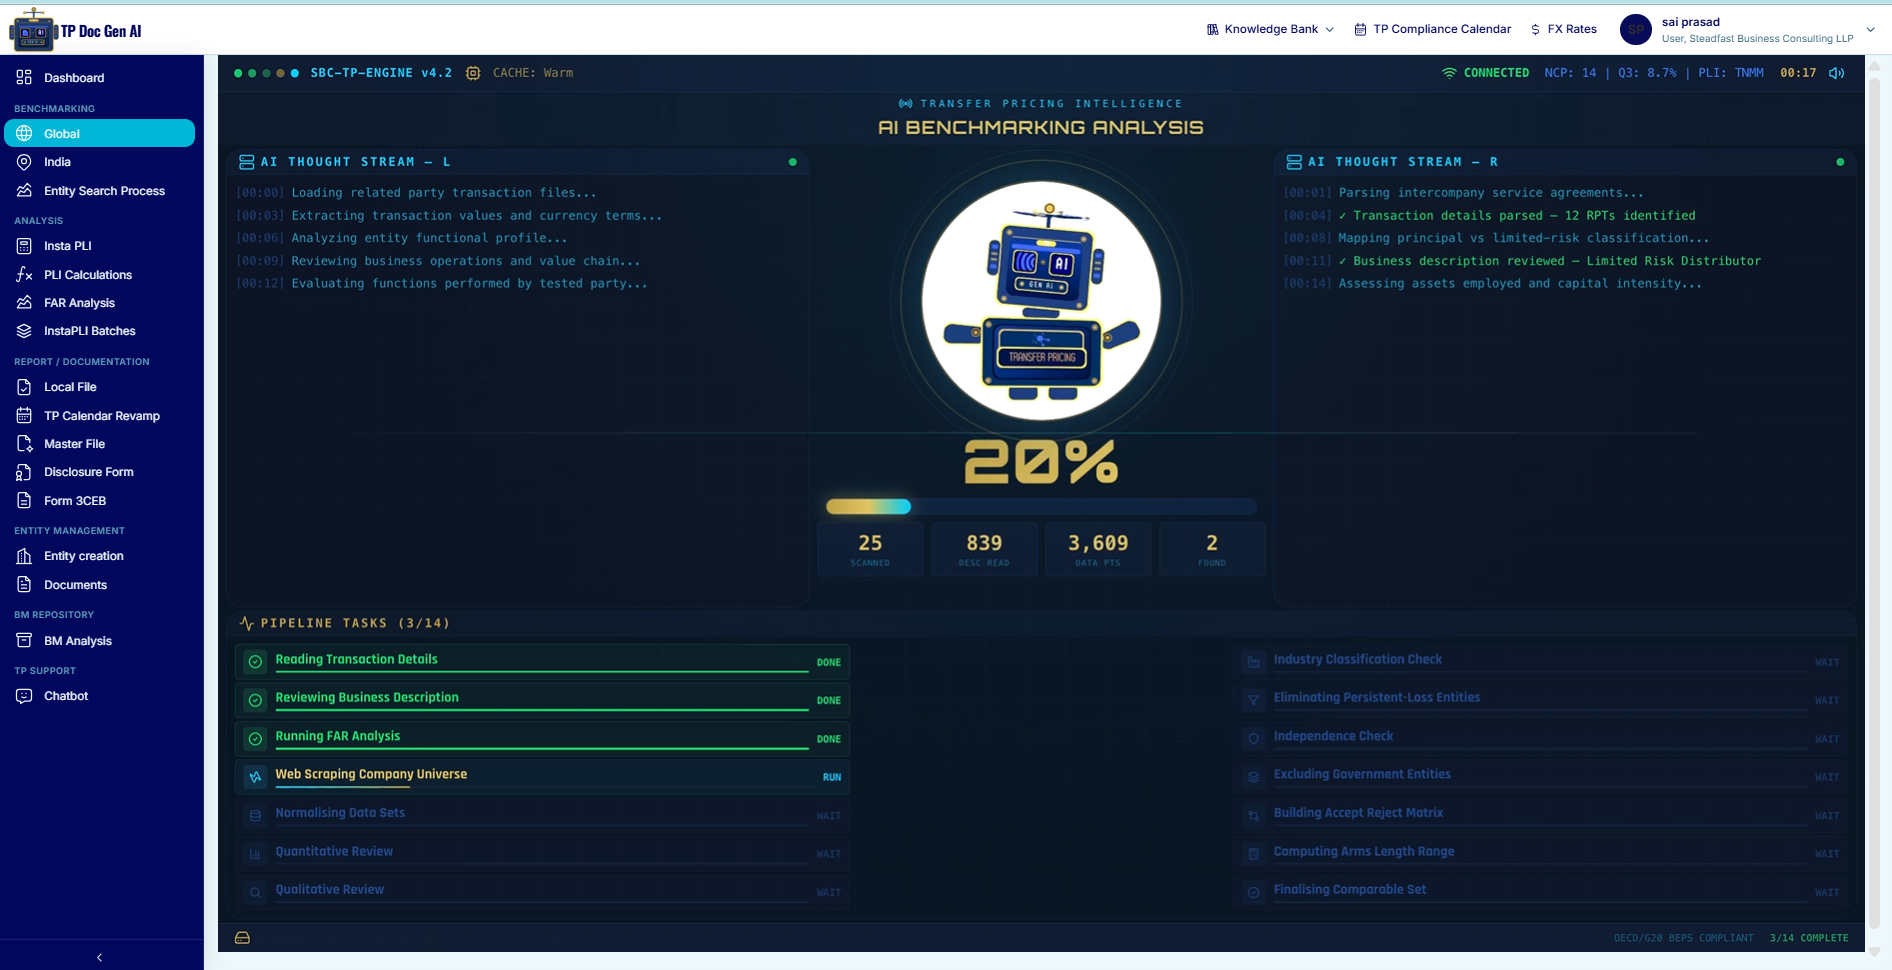
Qualitative screens (industry, functions, geographic market, product) and quantitative screens (independence, persistent losses, related-party intensity, NACE / NIC codes) should be written down before the extract. More than 200 predefined filters exist in the product so a firm can standardise those screens across engagements. Prowess covers India. TP Catalyst covers global and Middle East sets. Both are wired end-to-end. "Export and rework in Excel" is the process we are replacing.
The accept/reject matrix is reconstructed from the database export. If a company failed a screen, the reason stays attached to the company. That is the page an audit officer photocopies.
Score comparables against the tested party, not against each other
FAR scoring is 0–100 across industry alignment, functional similarity, risk profile, and operations similarity (25 points each), with live web search and a written rationale. A distributor of industrial chemicals is not comparable to a distributor of fashion apparel merely because both have "distributor" in the database industry string. The score is there so a partner can change a weight without throwing the set away.
Compute PLIs that reconcile
Instant PLI reads up to five PDF or Excel files (including scans, via vision), classifies the entity type, and applies deterministic rules that override the model for known line items. Twelve ratios are computed, including OP/OR, OP/OC, GP/Sales, Berry ratio, EBITDA/OR, and ROCE. We do not claim "16+." Operating profit must equal operating revenue minus operating cost or the result is blocked. Deterministic mode is on by default: same document in, same numbers out.
Quartiles in the Local File are code. The model may draft commentary. It does not invent a percentile. Eleven tested-party margin indicators can be computed for broader benchmarking reports. UAE entities can receive a 51-section report that includes Article 34 analysis rather than a global cover sheet.
Advisory still owns the judgement
Software cannot decide if a CUP exists, whether a loss-making entity should be the tested party, or how to treat a restructuring. SBC's TP advisory practice still owns those calls. The Benchmark Vault exists so repeated distributor fact patterns reuse screens instead of reinventing them every March.
We repeat two public stats: 80% reduction in benchmarking time, 70% faster turnaround versus manual drafting. We will not invent a rupee ROI. See the methodology page and audit defense. To run Prowess or TP Catalyst on a set you choose, request a walkthrough.
Write the screens before you love the set
Independence, persistent losses, and related-party intensity belong in the memo before the extract. Berry versus OP/OC is characterisation, not a button. Instant PLI will compute both. The worksheet exists to reject a PLI that does not reconcile. That is the part a senior partner still has to look at.